Split backtest results by market regime: trend, range and shocks
The same trading rule can win in a trending market and lose in a ranging one. Splitting backtest results by the market regime at entry shows where a strategy actually makes and loses money. This guide covers how to label regimes and the mistakes to avoid when you do.
What the total hides
Say a strategy finished at -2%. It might lose a little everywhere. Or it might win big in trends and lose slightly more in ranges. Same total, very different next steps.
In the second case you do not need to throw the rule away. You can add a condition that skips ranging markets, or pair it with a separate rule for ranges. In the first case, the idea behind the rule is what needs work.
Example: one breakout rule across regimes
In the Hawk Backtester demo I ran a breakout rule (enter when price breaks the 40-bar high or low) on synthetic data, changing only the type of market. The data is randomly generated, 1,500 hourly bars, not a real market.
| Market | PnL | Win rate |
|---|---|---|
| Trending | +10.20% | 48% |
| Ranging | -6.10% | 23% |
| Volatile | -4.73% | 27% |
| Mixed | -2.29% | 29% |
Breakouts doing well in trends and badly in ranges is textbook. But looking only at the mixed result of -2.29%, you would never see it. I did not know how my own rules behaved per regime until I actually split them.

How to label market regimes
Real data does not come with a label saying "this bar is a trend". You have to define the rule yourself. Three common approaches:
ADX for trend strength
ADX (average directional index) measures how strong a trend is, regardless of direction. A typical split is ADX above 25 for trending and below 20 for ranging, with +DI vs -DI giving the direction. Those thresholds are convention, and the right values depend on the instrument and timeframe.
Moving average slope for direction
For example, the percentage change of a 50-bar moving average over the last 10 bars. Above a threshold is an uptrend, below the negative threshold is a downtrend, in between is a range. It is easy to reason about and easy to check by hand.
Volatility level
Compare ATR, or the rolling standard deviation of returns, with its own history. For example, call the top 10% of the past year "volatile". This is a separate axis from trend vs range, so it combines well with the other two.
# Label the regime at entry, using only past data
ma = close.rolling(50).mean()
slope = ma.pct_change(10) * 100          # % change of the 50-bar MA over 10 bars
vol = close.pct_change().rolling(20).std()
vol_rank = vol.rolling(24 * 250).rank(pct=True)   # position within past history

def regime_at(i):
    if vol_rank.iloc[i] > 0.9:
        return "shock"
    if slope.iloc[i] > 0.3:
        return "up"
    if slope.iloc[i] < -0.3:
        return "down"
    return "range"

# tag each trade with the regime of its entry bar
trades["regime"] = [regime_at(t.entry_index) for t in trades.itertuples()]
The thresholds (0.3%, top 10%) are only examples. Overlay the labels on a chart for your instrument and timeframe and check that they look sensible before you rely on them.
Why use the regime at entry
Label each trade with the regime at the moment it opened. The market often changes while a position is open, but the strategy can only act on what it knew at entry. Grouping by the entry regime means a finding turns directly into a rule: "do not enter when the market looks like this".
Common mistakes
Labeling with future data
The most common mistake is letting future information into the label. "A trend is any stretch where price moves 5% over the next 50 bars" produces clean labels in hindsight, but none of it is known at entry. Filter trades with that label and the backtest looks better using information you could never have had. Centered moving averages and means or standard deviations computed over the full period have the same problem.
Too few trades per regime
Sixty trades split four ways is about fifteen per regime, and volatile periods are short, so some buckets end up with only a handful. A couple of large trades can flip the result. Treat small buckets as a hint, not a finding. The Hawk Backtester demo ignores regimes with fewer than three trades when it generates hints.
Tuning the regime rule itself
The regime definition is a parameter too. Trying many thresholds and keeping the one with the best result fits the backtest to that period. The same thinking as in the overfitting guide applies.
What to do after splitting
- Add a condition that skips the losing regime, for example no breakout entries when ADX is under 20, then check it on a different period.
- Look at how trades lose in each regime. Losers that were in profit first point to the exit; losers that went wrong right away point to the entry. The MFE and MAE guide explains how to tell them apart.
- Check another period or instrument. A bias that shows up in one period only may be chance.
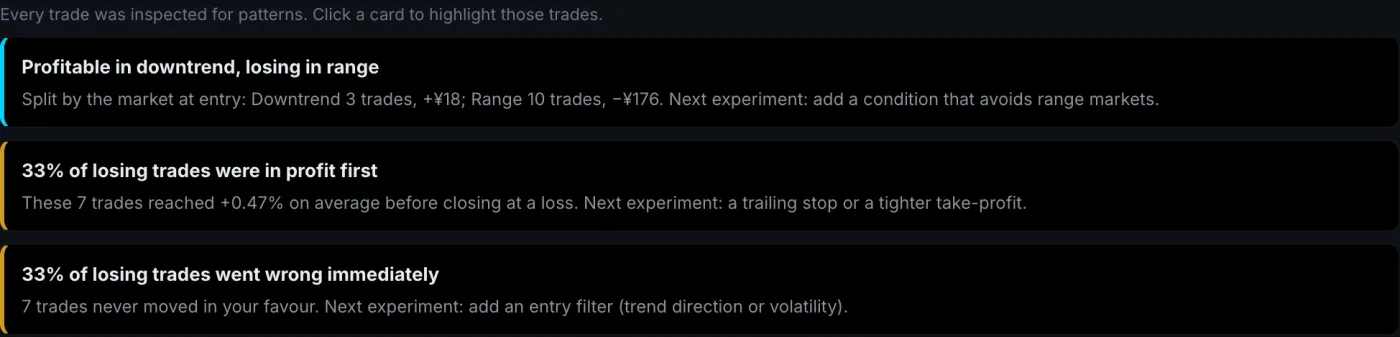
Because the Hawk Backtester demo uses synthetic data, the regime of every bar is known exactly. That makes it a good place to see what splitting by regime reveals without worrying about labeling errors. With your own data, you would define a labeling rule like the one above.
FAQ
What is the best indicator for telling trends from ranges?
None is best in every case. ADX measures strength without direction, a moving average slope measures direction, and volatility measures the size of moves. Pick based on what you want to know, then overlay the labels on a chart and check them by eye.
Can I use different parameters for each regime?
You can, but every extra parameter makes it easier to fit past data. Make sure each regime still has enough trades and that the conclusion holds on another period.
If a strategy wins in a regime in the backtest, will it keep winning?
There is no way to know. A backtest describes how a rule behaved on past data and does not predict future results. Use regime analysis to understand a strategy, not as a forecast.