How to avoid overfitting a backtest when you optimize parameters
Overfitting a backtest means tuning parameters so closely to past data that luck gets counted as skill. To avoid it, stop picking the single best parameter set. Pick the middle of a region where the neighbouring values do almost as well, then check it on data you did not optimize on.
Why the best parameter set breaks on new data
Try 7 values for the fast moving average and 7 for the slow one, and you have run 49 backtests. The best of those 49 is the strategy's real edge plus whatever luck that particular combination had in that particular period.
The more combinations you try, the more likely it is that some of them look good by chance. This is the multiple testing problem. Picking the top cell is a procedure that systematically selects for luck.
That luck does not repeat on new data, so results usually get worse out of sample. Some decay is normal. The problem is when the decay is large enough that there is no strategy left.
Signs your backtest is overfit
- Moving one parameter a single step from the best value makes results drop sharply
- The total PnL is large but there are only a few dozen trades
- Most of the profit comes from a handful of trades
- There are many parameters and many special-case conditions
- Shifting the test period a little changes the best parameters a lot
One of these alone does not prove overfitting. If several apply, discount the result heavily.
Reading a parameter heatmap: spikes vs plateaus
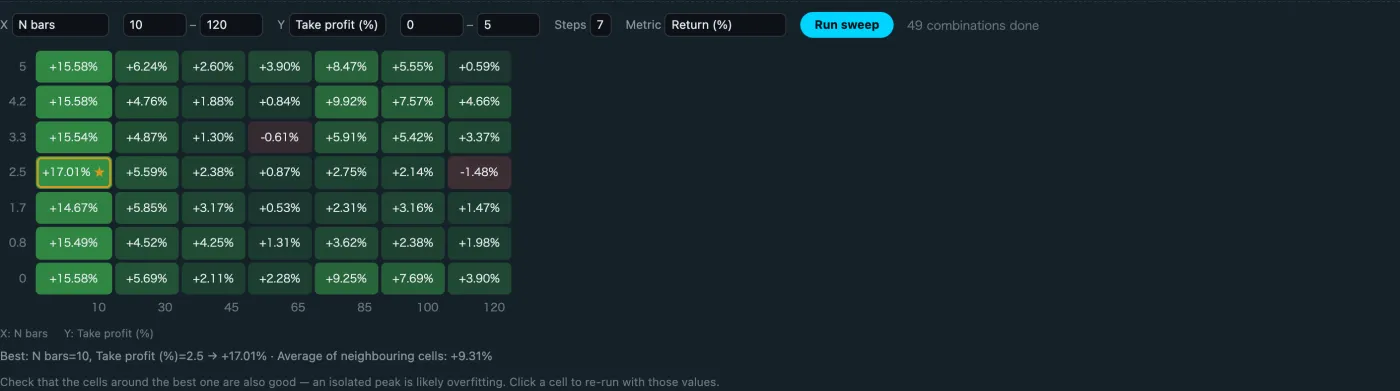
Sweep two parameters and colour each cell by the result, and you get a heatmap. The interesting part is not the darkest cell. It is the cells around it.
| Shape | What you see | How to read it |
|---|---|---|
| Spike | One good cell, weak neighbours | Likely driven by luck |
| Plateau | A wide area of decent results | Tolerates parameter drift |
| Flat and poor | Nothing works well | Rethink the rule, not the parameters |
The Hawk Backtester heatmap prints the average of the surrounding cells next to the best cell. A best cell at +8% with a neighbour average of −1% is hard to trust. A best cell at +4% with neighbours averaging +3% is more likely to keep its shape on other data.
Choose a value near the middle of the plateau, not the peak. The number you see goes down a little, and in exchange it depends less on luck.
Test on data you did not optimize on
A plateau is still a judgement made on the same data. The final check uses data the optimization never saw.
- Split the data, for example 70% in-sample and 30% out-of-sample
- Sweep parameters on the in-sample part only and pick the middle of a plateau
- Freeze those values and run the out-of-sample part once
Do not go back and re-pick parameters after looking at the out-of-sample result. If you do, the out-of-sample data has become part of the optimization and stops being a test.
Walk-forward analysis
Walk-forward analysis repeats that split while sliding the window. Optimize on one year, test on the next three months, move everything forward three months, repeat. Stitching the test windows together gives a picture close to what you would see if you re-tuned the strategy on a schedule.
Use fewer parameters and fewer conditions
Every extra parameter multiplies the number of combinations, and more combinations means more chances to find a lucky one.
- Fix parameters that barely change the result when swept
- Skip conditions you cannot explain, like excluding Tuesdays
- Use coarser steps: 10 values in steps of 5 rather than 50 values in steps of 1
Always check the trade count
With 20 trades, two or three outcomes swing the total. Switch the heatmap metric from return to trade count and check that the best cells are not simply the ones with very few trades. Cells with tiny trade counts are safer to drop, however good they look.
Change one thing at a time and look at which trades changed
Overfitting also happens by hand, as you tweak a rule bit by bit. Each tweak may raise the total, but the total cannot tell you whether the rule improved or a few trades happened to go your way.
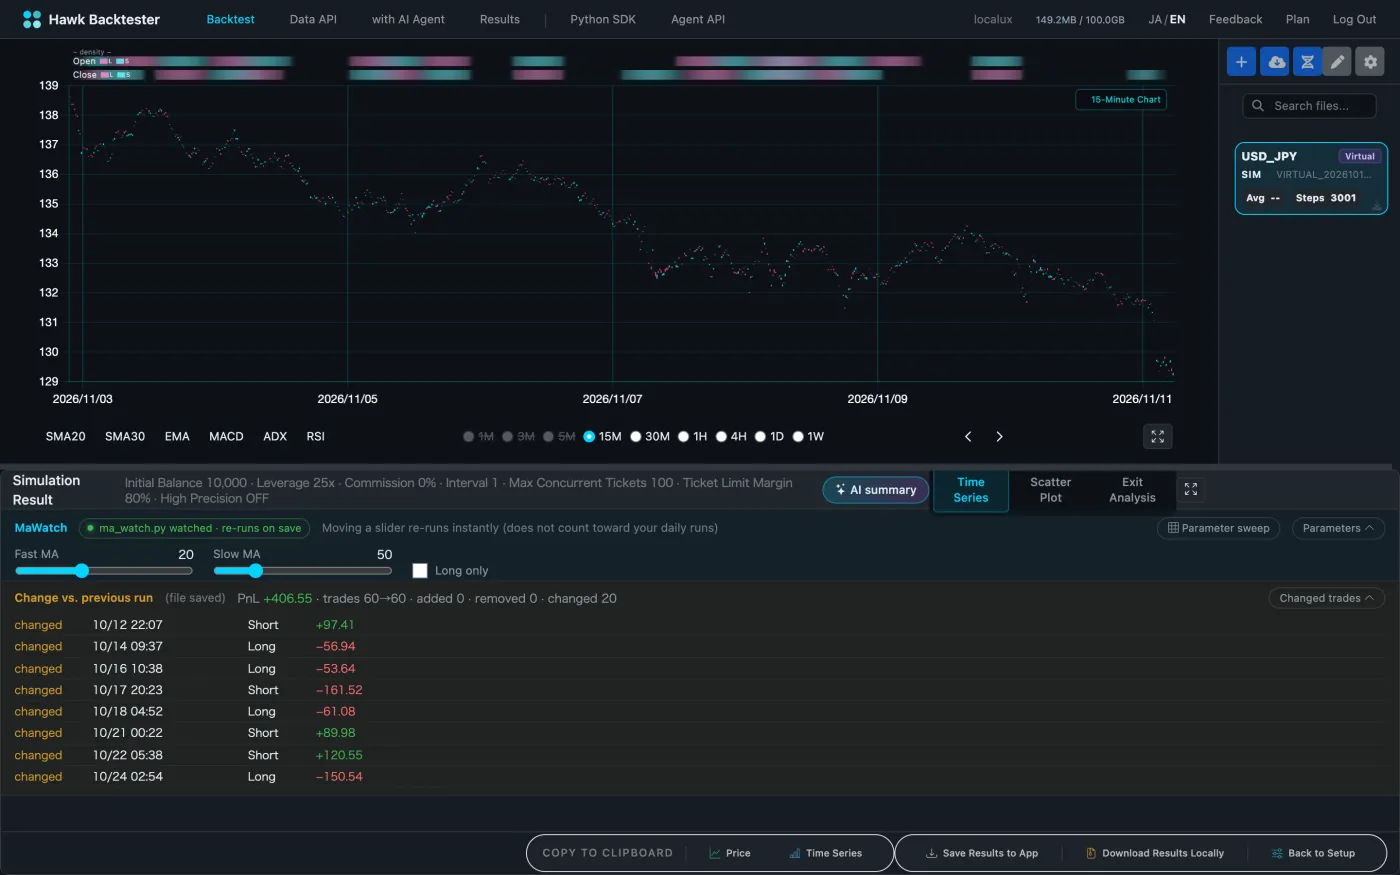
Change one thing per run and check which trades changed. Hawk Backtester lists the trades whose outcome differs from the previous run. When I moved a take profit from 1% to 2%, the trade count stayed at 60, but 20 trades ended differently and about half of those got worse. Looking only at the total, I would have called it a small improvement.
For splitting losing trades by cause, see MFE and MAE explained. To check whether a result depends on one kind of market, see splitting results by market regime.
FAQ
Is curve fitting the same as overfitting?
In trading they are used almost interchangeably. Both mean fitting past price data so closely that the result does not carry over to new data.
Should I stop optimizing parameters altogether?
No. Sweeps are useful for seeing how sensitive a rule is to its parameters. The mistake is trusting the single best point.
What if the out-of-sample result is bad?
Re-picking parameters based on it turns it into in-sample data. Go back to the idea behind the rule and test any new version on fresh data.