How to backtest a trading strategy in Python, and how to read the result
A Python backtest loads price data, applies your trading rule bar by bar, and adds up the profit and loss. You can write one in a few dozen lines of pandas. The hard part is the fill assumptions: get them wrong and the result looks better than it should, so it pays to know both how to write the test and how to read what comes out.
The basic steps
Whatever library you use, a backtest has four parts.
- Get price data (OHLC: open, high, low, close).
- At each bar, generate a signal using only what was known at that bar.
- Decide at what price each signal gets filled.
- Add up PnL and costs from the filled trades and summarise them.
Steps 2 and 3 are where most mistakes happen. Use information from the future, or fill at a price you could never have got, and the backtest flatters you.
A minimal backtest in plain pandas
Here is a moving average cross with no backtesting library. It holds a long position while the fast average is above the slow one.
import pandas as pd

df = pd.read_csv("usdjpy_1h.csv", parse_dates=["time"], index_col="time")

fast = df["close"].rolling(10).mean()
slow = df["close"].rolling(50).mean()
signal = (fast > slow).astype(int)      # 1 = long, 0 = flat

# enter at the close of the signal bar, earn the next bar's move
position = signal.shift(1).fillna(0)
ret = df["close"].pct_change().fillna(0)

# charge spread and fees whenever the position changes
cost = position.diff().abs().fillna(0) * 0.0002
equity = (1 + position * ret - cost).cumprod()

print(f"total return: {equity.iloc[-1] - 1:.2%}")
The line that matters is shift(1). Without it, a signal computed from a bar's close also earns that same bar's move. That trade is impossible in real life, and it makes the result look much better.
Three pitfalls in hand-written backtests
Look-ahead bias
The signal uses a value that was not known yet at that time. Besides a missing shift, it shows up when you normalise with a mean or standard deviation computed over the whole dataset, or use a bar's high and low to decide an entry inside that bar.
Optimistic fills
Entering at the signal bar's close or at the next bar's open can change results a lot. Take profit and stop loss matter too. If a bar gaps through your stop and you still fill at the stop level, you underestimate the loss. The fill assumptions guide goes through these cases.
No costs
Leave out spread and fees and the strategies that trade the most look the best. On short timeframes, adding costs alone can flip the sign of the result.
My own engine had four bugs of this kind. Take profit and stop loss filled at the bar's close, the spread had the wrong sign, and so on. Fixing them moved the same strategies' results by up to 4%, and the ranking between strategies changed.
Read more than the total PnL
Once the backtest runs, you need to read it. Total PnL and win rate rarely tell you what to change. These four views usually make a strategy's character clear.
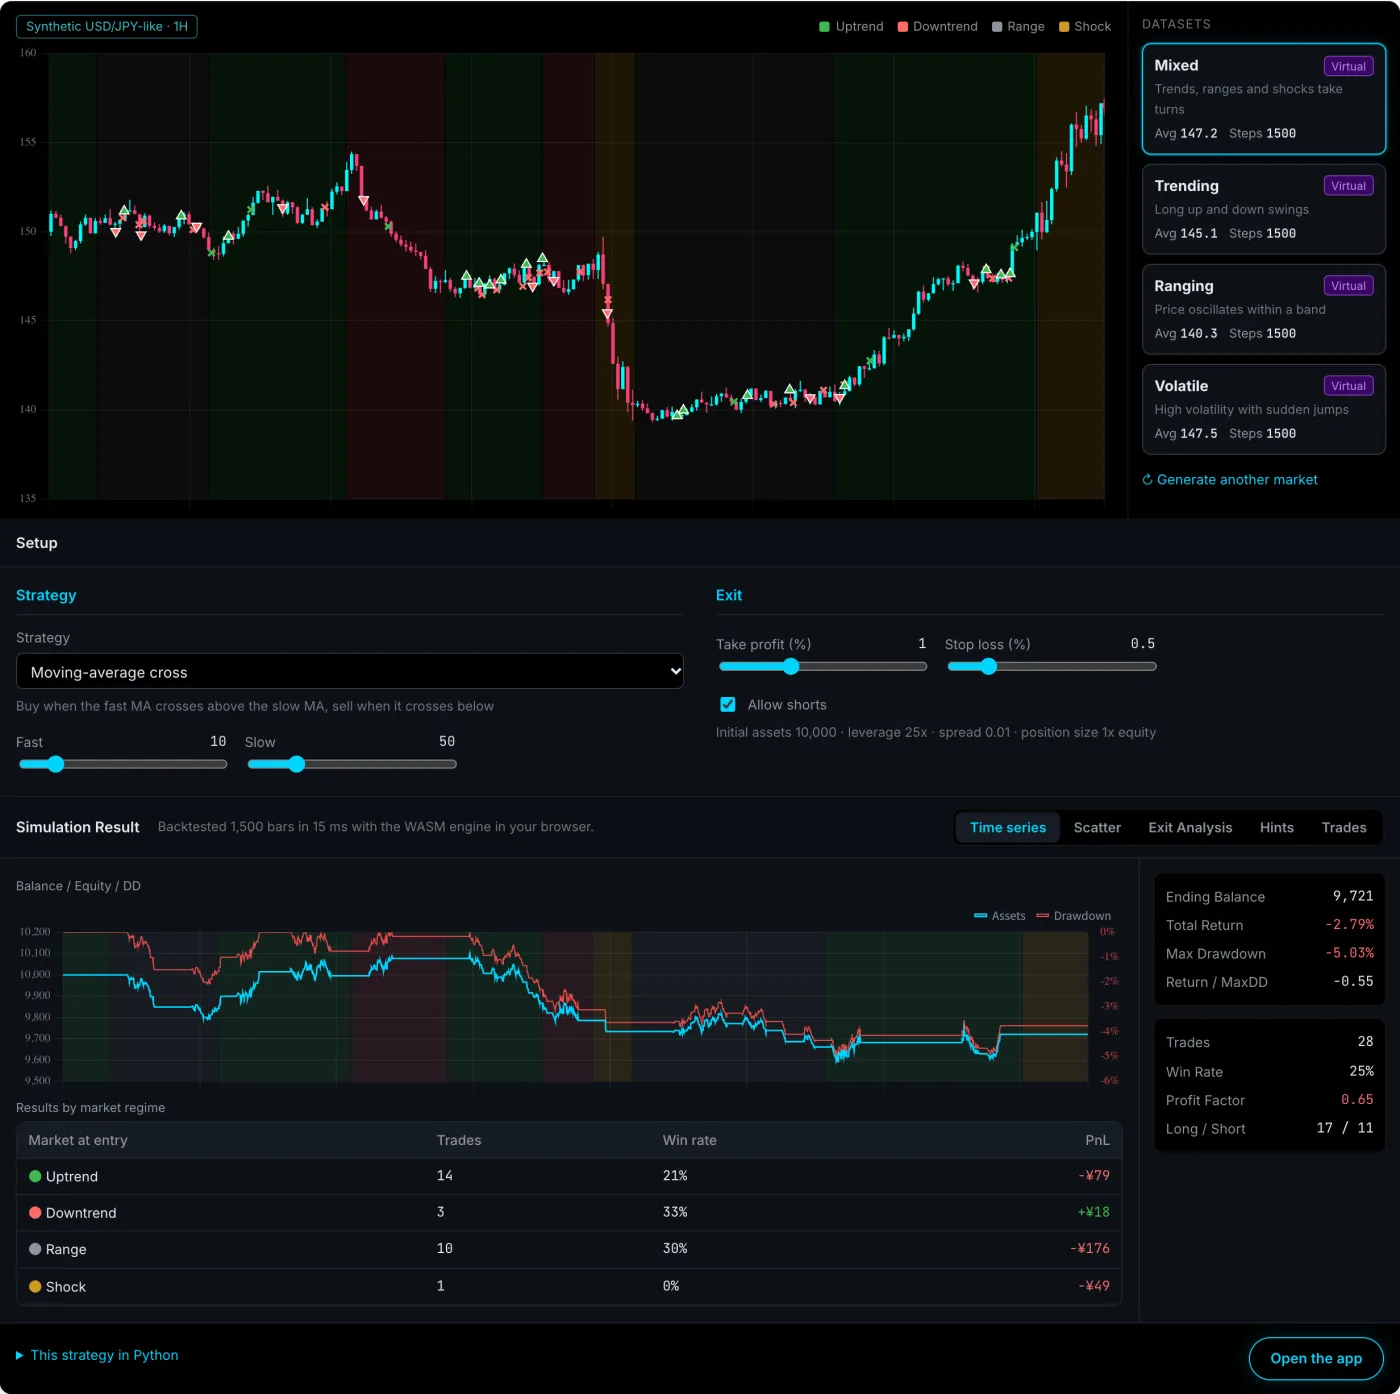
- Results by market regime. Many rules win in trends and lose in ranges. See splitting results by market regime.
- Each trade's best open profit and worst open loss (MFE and MAE). A loser that was in profit at some point needs a different fix from one that went wrong right after entry. The first points to the exit, the second to the entry. See MFE and MAE explained.
- Why each trade closed. The split between take profit, stop loss and the opposite signal.
- What happens when a parameter moves a little. If only the single best value looks good, suspect overfitting. See avoiding overfitting.
With plain pandas you write these breakdowns and charts yourself. Keeping a list of trades (entry time, exit time, prices, exit reason) instead of only an equity series makes that much easier later.
The same idea with hawk-bt
In Hawk Backtester a strategy is a Python class. Your code runs on your own machine and talks to the engine in the browser over a localhost websocket. The code is never uploaded.
pip install -U hawk-bt
hawk-bt run my_strategy.py
from hawk_bt import Strategy, Context, Param
class MaCross(Strategy):
fast = Param(10, min=3, max=50, step=1) # shows up as a slider
slow = Param(50, min=10, max=200, step=5)
async def step(self, ctx: Context) -> None:
i = int(ctx.state.snapshot.step)
fast, slow = self.fast, self.slow # a Param reads as a plain int
if i < slow + 1:
return
close = ctx.state.candles.close[:i] # closes of completed bars only
f_now, s_now = close[-fast:].mean(), close[-slow:].mean()
f_prev, s_prev = close[-fast - 1:-1].mean(), close[-slow - 1:-1].mean()
if f_prev <= s_prev and f_now > s_now: # fast crosses above slow
price = ctx.state.snapshot.price
await ctx.engine.place_ticket(
side="buy", units=1,
take_profit=price * 0.01, # TP/SL are price distances
stop_loss=price * 0.005,
)Compared with a hand-written loop, a few things are handled for you.
- No future bars. At each
stepthe strategy only sees bars up to the current one. - Defined fills. Take profit and stop loss fill at their level, or at the open if the bar gapped through. If one bar touches both, the stop is assumed to come first. Spread, fees and slippage are charged. The rules are written down in the simulation model.
- Parameters become sliders. Every
Paramappears as a slider in the results view. Moving it re-runs your local code with the new value. - Re-run on save. Saving the file re-runs the backtest, and the app shows which trades were added, removed or ended differently compared with the previous run.
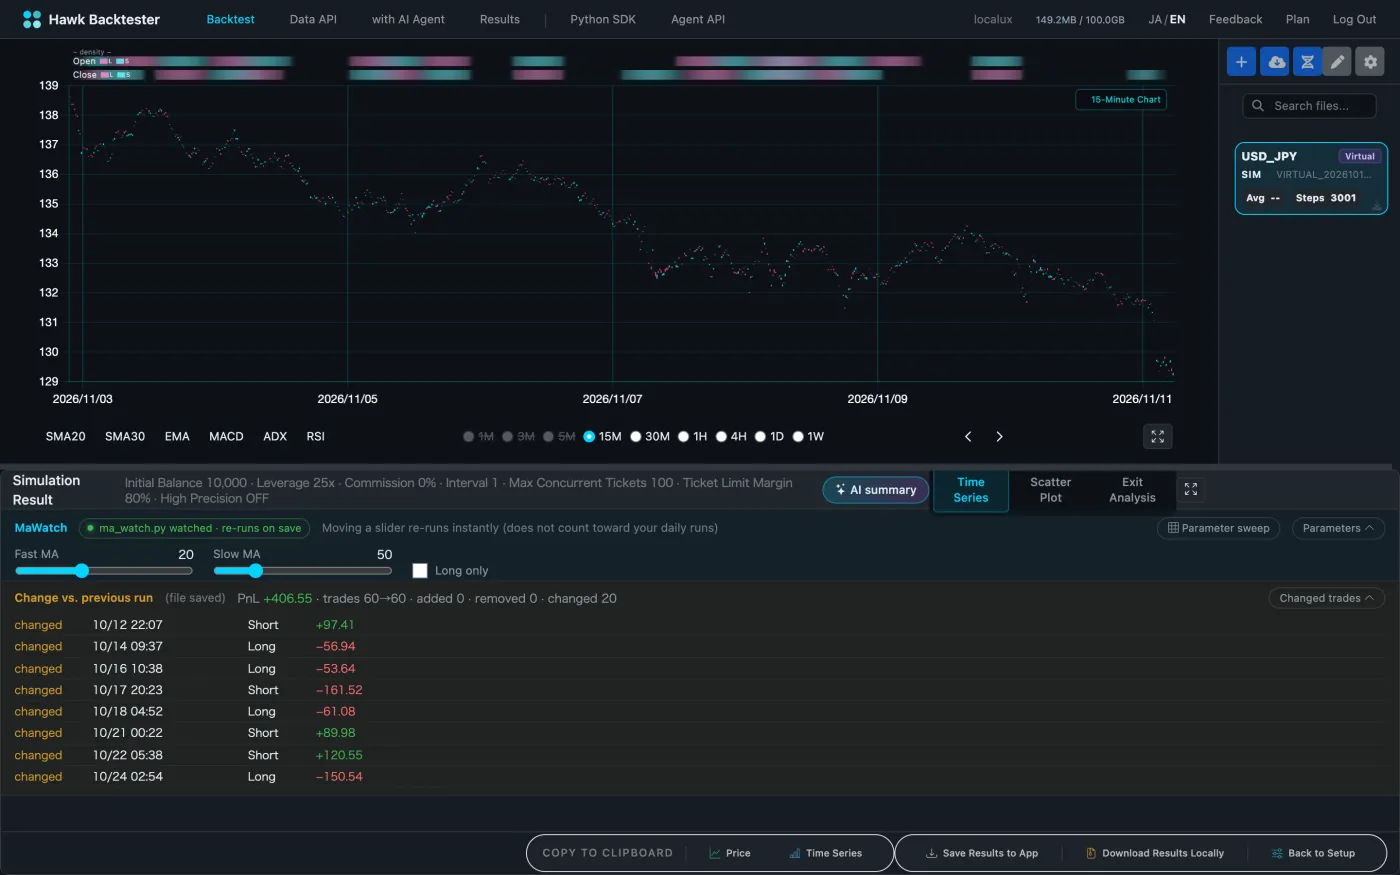
The diff lets you check a change that only nudged the total. When I widened a take profit from 1% to 2%, the trade count stayed at 60, but 20 trades ended differently and about half of those got worse. From the total alone it looked like a small improvement.
Getting data
You need price data to backtest anything. Hawk Backtester does not bundle market data. You can:
- upload a CSV,
- generate synthetic data where trends, ranges and shocks take turns, or
- import with your own data-provider API key (Twelve Data, for example). The key is stored encrypted and only used for your imports.
If you write your own backtester, check how your data is timestamped first: the time zone, and whether a bar is labelled by its open or its close. A mismatch there is a quiet source of look-ahead bias.
What it can't do yet
Hawk Backtester handles one instrument per backtest. Portfolios and tick data are not supported yet. The app is built for desktop; on a phone only the no-signup demo really works. Pricing is on the plans page, and the free plan has no limit on the number of backtests.
FAQ
Which Python backtesting library should I use?
It depends on the job. vectorbt suits fast parameter sweeps in a notebook. backtesting.py and Backtrader suit writing one strategy in a straightforward way. There is a comparison in choosing a backtesting tool.
If a backtest looks good, will the strategy make money live?
There is no guarantee. A backtest tests the past, and the result depends on fill and cost assumptions. Use it to learn how a strategy behaves, not as a forecast.
Does hawk-bt upload my strategy code?
No. The code runs on your machine, and only order instructions reach the engine in the browser.