MFE and MAE explained: split losing trades into exit problems and entry problems
MFE (maximum favorable excursion) is the largest open profit a trade reached between entry and exit. MAE (maximum adverse excursion) is the largest open loss over the same period. Recording both for every trade lets you tell whether a losing strategy has an exit problem or an entry problem.
What MFE and MAE measure
Both look at a single trade, from the moment it opens to the moment it closes. You can express them as a price difference, in pips, or as a percentage of the entry price. If you want to compare strategies or instruments, percentages are the easiest to work with.
- MFE: the distance from the entry price to the best price for the position while it was open. For a long, that is the highest high; for a short, the lowest low.
- MAE: the distance from the entry price to the worst price for the position while it was open. For a long, the lowest low; for a short, the highest high.
For a long position:
MFE = (highest price while open - entry) / entry * 100
MAE = (entry - lowest price while open) / entry * 100
# swap high and low for a short
# MAE is kept as a positive size: how far the trade went against you
A worked example (hypothetical numbers)
You buy USD/JPY at 150.00. It rallies to 150.60, then falls to 149.70 and hits your stop.
| Item | Price | As % |
|---|---|---|
| Entry | 150.00 | - |
| Highest while open | 150.60 | MFE +0.40% |
| Lowest while open (exit) | 149.70 | MAE 0.20% |
| PnL | -0.30 | -0.20% |
On PnL alone this is just a 0.20% loss. The MFE says the trade was up 0.40% at one point. The entry was fine. The money was lost on the way out.
Split losing trades into two groups
Once you have MFE and MAE, most losing trades fall into one of two groups.
Losers that were in profit first (an exit problem)
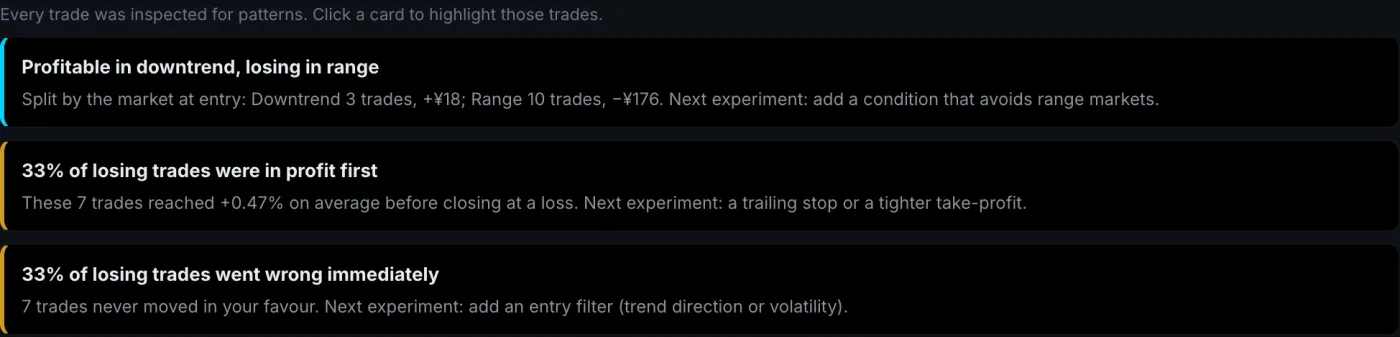
The trade moved your way, then reversed and closed at a loss. A useful rule of thumb is an MFE of at least half your take-profit distance. The entry timing worked, so the exit is what to look at: a closer take profit, a trailing stop, or a time-based exit.
Losers that went wrong right away (an entry problem)
The trade moved against you from the start and never showed meaningful profit. MFE is close to zero. Changing the exit will not help much here. Look at the entry instead, for example a trend-direction filter or a condition that skips very quiet or very wild periods.
Two strategies with the same 30% win rate can need opposite fixes depending on which group dominates. The total PnL and win rate cannot show you which one you have.
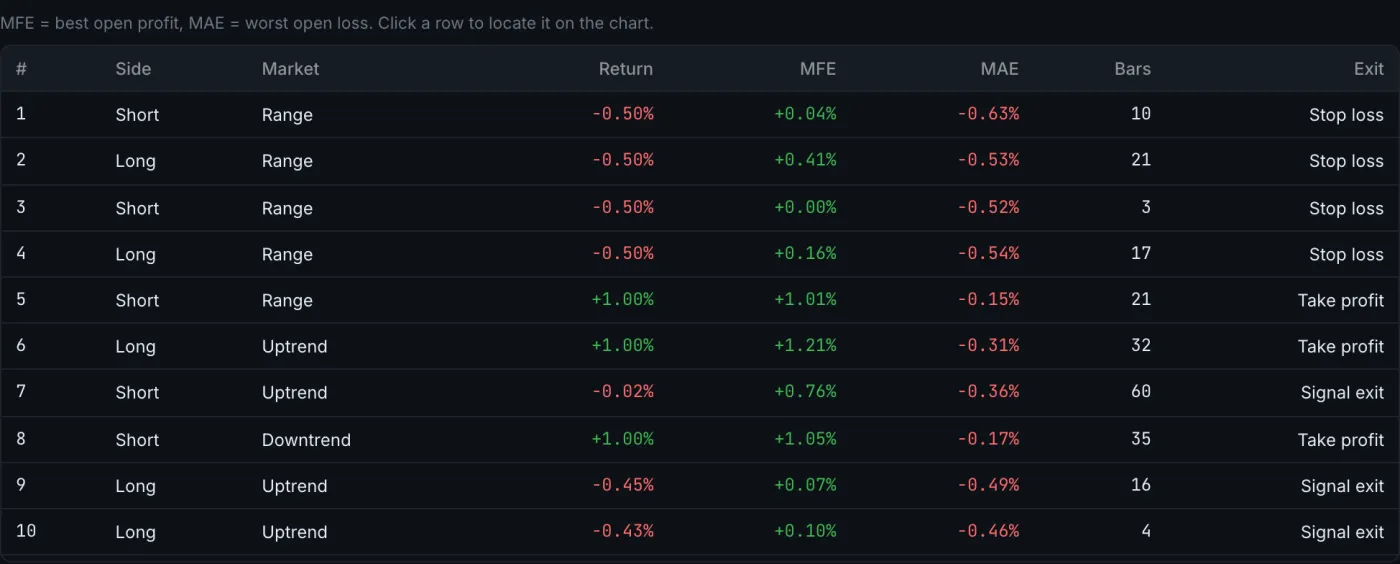
Use the MAE of winners to check your stop
MAE is most useful on the winning trades. How far did your winners go against you before they worked out? That distribution tells you whether your stop is too tight.
Say you have 40 winning trades and 80% of them had an MAE under 0.3% (made-up numbers). With a 0.2% stop, you would have been stopped out of some of those winners before they paid. If almost all winners stayed within 0.1%, a 0.5% stop is harder to justify.
How much of the MFE did you keep?
For winners, dividing PnL by MFE gives the share of the open profit you actually banked. It is often called the capture ratio or heat efficiency.
capture = pnl_pct / mfe_pct # winners only, mfe > 0A trade that reached +1.0% and closed at +0.3% has a capture of 0.3. A strategy with a low average tends to give back a lot before exiting. A strategy close to 1.0 may be taking profit so early that it misses the bigger moves. The number is not good or bad on its own, so read it together with the exit reasons. Hawk Backtester reports it as Heat Efficiency in the analysis results.
Reading an MFE vs MAE scatter plot
Plot MAE on the x axis and MFE on the y axis, coloured by win or loss, and the shape of the strategy shows up quickly.
- Many losers in the upper left (small MAE, large MFE): profit is being given back. Look at the exit.
- Losers clustered in the lower right (large MAE, small MFE): trades go wrong immediately. Look at the entry.
- The share of trades above the MFE = MAE diagonal: how often a trade moved further in your favour than against you.
Caveats with bar data
Most backtests run on bars, such as hourly candles. A bar does not tell you whether its high or its low came first, which affects MFE and MAE in a few ways.
- Entry and exit bars: if you include their full high and low, you may count price movement that happened before you entered or after you left.
- TP and SL on the same bar: the backtester has to assume which came first. That assumption changes MFE, MAE and PnL.
- Gaps: if price opens beyond your stop, MAE ends up larger than the stop distance.
Check how your tool handles these. Hawk Backtester documents its rules on the simulation model page, and the fill assumptions guide shows how much they can move results.
FAQ
Should I measure MFE and MAE in pips or in percent?
Pips are fine for a single instrument on a single timeframe. To compare instruments at different price levels, or different periods, use a percentage of the entry price.
Can MAE be larger than the stop distance?
Yes. A gap through the stop or slippage can do it, and with bar data the low of the stop-out bar is often below the stop price.
How many trades do I need?
There is no fixed number, but splitting losers into two groups halves each sample. With fewer than about ten trades in a group, treat any conclusion as a guess.